Thresholds and social persuasion

I’ve written about thresholds in previous posts but I wanted to refresh my memory before I further explore the role of influentials in shaping our trends and opinions. It’s going to be a long few posts until I get to the point which I want to make, but bear with me.In every day life, a threshold is the point that ‘something happens’ to a stable state in a certain situation. For example, water has a temperature threshold before it boils, you’ll have a threshold for the number of beers it takes you before you need to pee or for the number of packed tube trains you let go in the morning before braving it and squeezing on next to the sweaty fella.

It has a similar meaning in a social sense. People in your network have an influence on you. The network model of thinking is based on contagion and suggests that this manifests itself in a number of ways – from you accepting societal norms, to the purchase of a new car. Your threshold is the number of people who are influencing you at the time you ‘change’ and can be written as a fraction or probability.

The more people that influence you to do something, the more likely to are to do it. The lower your threshold, the less persuasion required. For example, if it takes 2/3 of your friends to purchase a new style of clothing, then you will also buy it once that bar has been reached. If only 1/5 of your peers has already purchased those pair of tights  then you are unlikely to.

More formally, thresholds can be written as:

The probability of  adopting B is certain if the number of people who influence i () is equal or greater than i’s threshold (). Conversely there is no chance of i adopting if the number of people is less than its threshold.
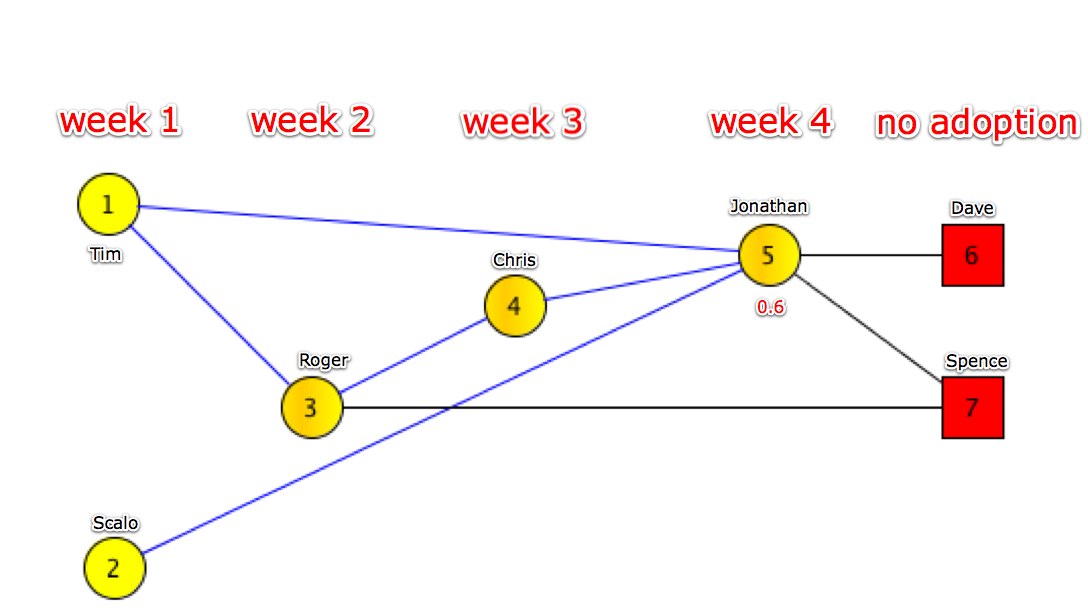
An example I’ve used previously to explain how thresholds work is the smacking of children. Very simply, if more people in your social group smack their child then you would be more likely to do so (or certainly believe it to be more acceptable).
Boring illustration

Let’s take a real life example. This is a pretty dull story even by my network analysis standards (even worse is that I’m actually embellishing it slightly). A year ago, Jonathan Brigden, my former Porter Novelli colleague, was looking at getting a new games console because he’d become tired of playing Brian Lara Cricket on his PSOne. As one of the digi geeks at Porter Novelli he assumed I was a gamer and asked my opinion. I suggested he get an XBox 360 because I have one and the games are probably more suited to him. He was aware that the XBox would be more within his price range than a PS3 and he could also access Sky channels using his dad’s subscription but yet he still remained unconvinced.

However, two weeks later, he overheard a conversation I had with Roger, another colleague (who had just purchased an Xbox 360 on my recommendation) about playing Fifa 10 online against each other. This followed a conversation he had with two other colleagues (Chris – who bought one based on Roger’s recommendation – and Scalo) who had also recently purchased one. Having realised that there were now four of us who already had an Xbox 360, he purchased one at next pay day so we could all play each other online. We literally spent the whole of the next six months playing Fifa 10 together and geeking off about it at work via emails. At the same time, we also ostracised Dave and Spence who own a PS3 from our incredibly interesting email banter.

We can illustrate his decision making as such:

Jonathan adopts at week 4, by that time three out of five of his trusted colleagues have an Xbox 360, therefore his threshold would be 0.6. Roger, who adopts at week 2 would have a threshold of 0.33, at his time of adoption he only has one out of his three peers with an Xbox 360. Just to reiterate the importance of the social aspect of this, now that all of us have gone our separate ways, none of us talk to each other apart from via Xbox Live.
Contagion is not persuasion

But it’s obviously not always so simple. Although some people like to compare the spread of trends with virused, there are a whole number of factors that influence whether a person adopts an innovation other than simply being exposed to it. Depending on what you read, there are various names for these types of influences, however, the following seem to cover most of it:

Information:
Sometimes called ‘social recommendation’. This is the recommendations or information about the innovation from someone else. i.e. A neighbour or magazine review telling you to purchase a certain brand of paint because it lasts longer

Financial/ Mechanical:
This refers to more pragmatic/ practical reasons for adopting an innovation. The adoption of fax machines is the generic example. i.e. You need to start using fax machine because your customers and suppliers are using it

Social Conformity:
The social pressure associated with being affiliated with a group of people. i.e. You need an iPhone so that you can take part in cool conversations about apps

Why it’s not quite so easyAnother caveat about thresholds is that they can only really be assessed post change. Every one of us has a different threshold for different actions and it is impossible to predict. The purchasing of the iPad would be different to changing your perception on using brothels for example.

What’s the point of this post?

However, when devising campaigns, understanding types of people and what kind of threshold they have is a good place to start. We could start by targeting those with naturally lower thresholds. This shouldn’t be anything new to you, there’s a better chance of early adopters talking about and using our shiny new thing, be it computer geeks or fitness freaks. They talk about it within their network and influence others. Eventually, those who usually do not adopt will be overwhelmed about how great the thing is and cave in. Unless it’s crap obviously.

There are also ways in which we could actually artificially lower people’s thresholds. For example, we have seen how Jonathan Brigden bought my friendship by deciding to purchase an Xbox360. There are a number of instances where PR could have affected his decision.

After turning to us for our feedback, Brigden could have researched his options online potentially via search or relevant trusted sites. Here seeding positive messaging (such as reviews) and appearing high on search engine results pages would be highly desirable.

We could also create the impression that either everyone already has or is buying an Xbox. This works on a number of levels. Firstly, it suggests that if the person does not adopt the innovation then he or she will not ‘fit in’ or he or she is the ‘wrong ‘un’. For me, our society’s predisposition to having a wash has the same effect – if you lot didn’t do it, neither would I.

Secondly, it also reduces the risk associated with purchasing any new product. When buying a new car you are always conscious of how well it will run, whether it will cost a lot of money to fix or whether the wheels will fall off. The human race is programmed to pay attention to other people’s decisions because it is usually more reliable than not doing so. If lots of people are buying a certain car model then there is a perceived reduce risk in purchasing the car.

We could also target specific audience with similar messages so that consumers think other people ‘like them’ or people they aspire to be like are also adopting the new trend. Let’s face it, everything you see on the catwalk and on telly is a bit weird, and for blokes, usually camp. But as soon as Jude Law wears a cardigan in his new film, it’s seen as perfectly acceptable, even asiprational to copy him. It’s the reason why PRs send out so much free shit to celebs.

You can also see how these points could be applied online. Bloggers regularly look to trend setters in various industries such as fashion and technology. If you create an event for example, targeted at a group of bloggers and leave a few out due to limited space, there’s a fair chance that those few left out will be @’ing you on Twitter or emailing you asking for their invite. This is partly due because they want free stuff but also because they do not want to be left out of ‘their’ community.

If anyone’s seen the film, The Social Network, they did something similar when looking at universities to target. One university already had its own social network, so they Facebook went and targeted every campus within a 10 mile radius (or something) knowing that they would bump into each other regularly and eventually all migrate to Facebook.

The idea of thresholds is incredibly simple, mathematical but obviously highly flawed if we ignore the various other influences in people’s decision making. However, we can also see how one’s social circles can have a huge impact on decisions and opinion forming.

Ranking top UK PR blogs using social network analysis

Quick overview so you don’t have to read the whole thing:

You can rank blogs using social network analysis methods (well at least I think you can). I’ve done it for PR blogs – see last pic. Done.

Ranking

In society we don’t often rank people on a continuous scale; we usually group them discretely based on a number of demographics/ characteristics such as their level of education, class or profession. You wouldn’t give a rating out of ten for people you know – you’d label them along the lines of “friends”, “people you like”, “people you don’t know”, “people you don’t like”, etc.

It’s the same in PR; during a media outreach campaign, we tend to rank target press into tiers and prioritise them according to how important they are to the client. Blogger outreach is slightly more complicated. With the amount of information the web presents us with, it should be easier. But all too often many of us take data from Google, Yahoo, Alexa, inbound links, etc and pull them through an arbitrary algorithm which ranks the websites accordingly. It helps with the measurement/review process and confuses the hell out of clients. This post hopes to take some of the guess work out of this process or at least provide a viable alternative.

One way of looking at ranking is how a blog/website sits within its respective networks. My aim is to apply a bit more automation and maths to the process of identifying influencers. It’s never going to replace proper research, but – to some extent – it’s maths and if you accept the methodology, you cannot argue with the results (only how you interpret it).

To understand ranking using social network analysis, we have to understand how prestige, another measurement of influence, works.

Prestige

Think about the most popular person when you were at school. I’m not sure if this is the same in posh schools, but at mine the main characteristics of popularity largely depended on gender. For girls, she would simply be the hottest one (or as hot as a 15 year old could be). She went out with the 26 year old fridge repair man and occasionally stayed at his one bedroom flat above one of the estate’s many local off licenses. For the boy, it was whoever was hardest.

What made their popularity more apparent was that everyone wanted to hang out with them, but they just thought you and your mates were geeks. Prestige works in the same way. From a social network analysis point of view, popularity is the number of positive choices received by someone, while prestige also takes into account how many of those links are reciprocated. If there are two vertices in a network and the choices are symmetrical (i.e they both either like or dislike each other), we can assume that they are of the same rank. However, if the the ties are asymmetrical we would assume that the receiver is ranked above the sender.

When we are deciding whether to follow someone back on Twitter, most of us look at their follower/following ratio. If they are following 25,000 people and are only followed by 600 then we wouldn’t bother following them. However, if they have much more followers than those that they follow, then they must be of interest to some people. Obviously, not all positives choices are, well, positive. For instance if someone owes someone else money the ties would need to be reversed to take this into account.

Here’s a very simple Triad (a group containing three nodes) illustrating my point. If you want to know more about this, have a look at Triadic analysis and balance theory where you’ll see this particular triad referred to as 120U. Here we can see that there are two clusters: nodes 2 and 3, and node 1; node 1 is ranked higher than 2 and 3 (which are of the same rank).

This model (transivity) also presumes that like the chain of command in an army, if node 2 takes orders from node 1 then a node which takes orders from node 2, also takes orders from node 1. We might see this in how we receive news: Mashable reports on a particular story, which is then repeated by a blogger and then read by Person A. Person A is essentially getting their news from Mashable.

Structural prestige vs social prestige

Does high prestige equal high influence? Yes and no. Structural prestige does not always readily lend itself to real world situations. For example, a profession, such as a lawyer may be perceived as ‘prestigious’ (social prestige) but there are unlikely to be other many professions ‘linking’ to it. On the other hand, administrators may not be commonly associated with prestige but the profession is more likely to have a high ‘structural prestige’ in terms of the number of other professions it is linked to.

However, as with all types of influence I’ve discussed in previous posts there is often a very clear overlap and it is also dependent on the context. For example, although a lawyer may not be structurally prestigious (in terms of other professions linking to them), there is a good chance that many people will choose them as a source of information because of of their standing within a community.

Although there are other ways of measuring prestige (such as proximity or the input domain of the node) but for the purpose of this blog post, I will only be referring to the criteria outlined in the example below.

Ranking of UK PR Blogs

Quick overview explaining methodology

As a starting point, I’m using this list of UK PR Blogs to collect data. I believe Mat worked with a number of PR bloggers to put it together a while back for an experiment he was working on. I’m aware that there are quite a few blogs missing (top fella Ben Matthews‘ blog is one notable omitance). I’ll then use Porter Novelli’s Rufus Tool to spider the blogs and see how they all link together. I am making the assumption that a link from one blog to another suggests that the linker has read that site. Link backs may not be completely reliable, but it is essentially what Google does and who would argue with that? – well me, a bit further down.

I’m then going to run the raw data through an analytical software called Netdraw and delete all the sites that do not belong in the original seedlist. The resulting network will then be run through another analysis software called Pajek. If I have time (bear in mind it’s actually Christmas Day as I write this sentence) I might try and look at the types of sites and relationships between them, though it looks increasingly likely that I’ll save this for my Summer 2010 post.

Here’s the results:

Unprocessed network map


This is what the tool punts out initially before we process it. At the minute, there is too much information for it to be useful. What we can see is a massive cluster central to the map where I’d expect to find the well linked, older blogs and the newer Litman/Jed blogs somewhere on the peripheral but still fairly central. Just outside of this are the blogs which are related to PR but not strictly about it. If you look hard enough, you’ll see Will McInnes‘ blog and I suspect Mat’s there somewhere. A few year’s ago, these would have been probably more central but with so may me-too PR blogs only linking to other PR folk, they are increasingly peripheral to this network of PR bloggers. The next step is to begin parsing this list to make sense of it, which, in all honesty is a bit of a ball ache.

This involved, exporting the raw data as a VNA file and a little bit of Excel magic (with some vlookup action). Basically I asked Excel to highlight where there were duplicates of the original list and tagged them with the attribute, “ORIGINAL” and the others as “DELETE” which allowed me to literally switch off the websites I didn’t want to use. ‘Partitioning’ can also be used to label sites to give you an overview, for instance of how certain types of cancer sites interact with government sites and is an excellent method of painting an online landscape.

Netdraw

So when opened Netdraw I started with something like this:

Which once filtered looks a like this:

Now this is a bit nicer. Look at Jordan’s fairly recent Digital Prescription blog there, and notice how Geordie ASBO-dodger, Stephen ‘Ste’ Davies‘ hogs all the attention.

Analysing the network

What we can do using Netdraw is identify who is the most popular blog in this network (count the number of inbound links), highlight those that are an important conduit for the flow of information (betweeness centrality) and if i really could be bothered, we could also work out eigenvector centrality or Markov centrality (as described in my post a couple of months ago) but we won’t do all that. Here’s what it looks like when I’m just working it out popularity and betweeness.

I’ve sized the nodes according to its popularity or indegree (number of inbound links). It’s no surprise to find that the most popular are the more older blogs such as Mr Hobson‘s, Davies’ and Drew B’s blog. See my previous post about preferential attachment and the rich getting richer. Betweeness is interesting in this network. I’ve coloured them into three groups. The sites with low betweeness centrality are grey, orange nodes have medium betweeness and red nodes are high. The biggest winner in all of this is Drew’s blog, which is both the most popular and the most important for spreading information in the network. Other noticeable winners are Consolidated’s Mike Litman and Wildfire’s Danny Whatmough. I’m not going to read too much into this now, identifying these sites is something we’ve been working on for a while and I know Mat’s done a similar post recently. This is just me messing and getting distracted.

I’ve removed all the isolates (nodes with no ties) so Becky McMichael and a couple of others disappear completely. Now, straight off you can see that there are some problems with certain aspects of my methodology. Becky is definitely linked by a number of the other blogs and I would expect more connectivity overall. This could be because of a number of things:

  • The blog roll was made by Mat and a random mix of people. Therefore, it would be expected that there would be fewer interlinking nodes and more random blogs. Had I or Wadds compiled the list, I would expect the aforementioned PR blogs (Matthews, Dahljit, etc) to have been included because we are all bum chums.
  • There’s a lack of blog rolls on the home pages of many of the blogs. Jed’s blog for example has a separate page for his links, so while the Peter Pan of PR is a popular fella among the blogging community he’s a bit of a pariah in this network.
  • Bloggers failing to update their links also mean that for certain blogs the analytic software sees two different URLs. For example, the Rainier PR URL is still used by many for Wadds’ Tech Blog despite the change to Speed.
  • URLs are also often inconsistent on blogs. Ruder Finn’s Becky McMichael is listed as http://www.BeckyMcMichael.com on the original seed list, but the WordPress address is used on Simon Collister‘s blog roll. Again this proves problematic and unfairly omits some blogs.

I’m not sure whether I’m entirely correct in what I’ve pointed out – perhaps Mat can confirm that these are a problem? While we are nit-picking at my methodology, I thought I’d best highlight another caveat. In my experience, using links and blog rolls is not entirely reliable for assessing what people read. For example, I literally stole my blog roll from Jed, deleted it by accident and haven’t bothered replacing it – that’s how little I care about it. Future politician, Simon Collister has also failed to update his for two years it seems – see Alex Pullin’s link. Other bloggers throw out links to try get on other blogger’s radar because it costs them nothing. But it’s as good as indicator as anything to be honest. Also ignore bloglines.com – it’s just me messing around.

Using Pajek

This is where we can start analysing networks a bit more. I’m pretty sure you can do this in Netdraw but I’ve not been able to figure it out (well I can’t find the answer on Google). I’ve removed all the asymmetrical ties to identify clusters of mutual ties in the network. We can see that although overall the network is very clustered, there are actually very few mutual ties between blogs. In fact there are only five mutual ties (see my points above why this may not be entirely correct).

The next steps are a bit complicated – I’ve asked Pajek to shrink the network into strong components so that it is easier to work out how the groups are ranked. I’ve then mapped the original list of blogs on top of this small network and layered the network below to make more sense.

Noticeable winners are the aforementioned Davies and Hobson. If this was the Divine Right of Kings chart we use to see in history text books, the two of them would effectively be sharing the role of God. But it’s only me messing around with some toys (feel free to give yourselves a pat on the back though). Surprisingly, blogs by Drew, Michael Litman and Danny Whatmough, which were so highly ranked in terms of popularity and betweeness earlier are both in the fourth tier. This is perhaps due to the fact that while they all have a healthy amount of inbound links from others in the network, they also link out a lot. Again, people shouldn’t read too much into this – for a start, the Axicom blog is in the second tier.

So what does this tell us? Probably not too much at the moment. In some ways it’s correct in its assertion that Hobson and Davies should be the most highly ranked. However, the blogosphere probably doesn’t lend itself to this kind of ranking to identify influence – the flow of information is too decentralised, especially in this particular dataset where many bloggers link to each other out of politeness as much as anything else. If you look at content, there’s also not much going on in terms of newsflow – bloggers either come up with their own ideas or regurgitate something they saw on Mashable.

So I’ve been pretty much spent my Christmas pissing in the wind. However, what I should perhaps have done (had I had time) is to open the network up completely and not limit it to the original dataset. This would then allow us to see the flow of news in the overall UK PR blogs network (which we could tag). There are also many other ways you can rank blogs using a slightly different methodology – this is just one of them.

Diffusion in PR

Just a brief intro before I crack on. The last post was a bit theoretical and long and this is largely the same but probably more complicated, longer and certainly more difficult to explain. Before you read this ridiculously long post (it should be three or four different posts to be honest), a word of warning, there are more questions than answers – I’m just reading interesting stuff and testing it out. Don’t be hating.

Diffusion

In this post, I want to explore how time affects how a new idea or product is spread within a network and whether it has any actual practical uses for PR professionals. The general consensus is to use the term ‘innovation’ (for the new thing, idea, product or tool – if you are Zengestrom) and ‘adopt’. For those who read the last post, Markov centrality is about how quickly a message spreads through a network. The idea of adding a time dimension to network analysis is further explored by ‘diffusion’ which is “the process by which an innovation is communicated through certain channels over time among the members of a social system” (thanks Wikipedia). You’ve probably heard about Diffusion of Innovations, which explores adoption and much more in detail.

Diffusion works on two main assumptions. Firstly, that social relations is one of the most important channels for contagion and persuasion. Known as social contagion it implies that when you connect to people they also influence you. The assumption that social ties are important is because with an innovation, there is thought to be a risk associated with it because it is new and therefore an unknown quantity. Depending on the situation, family members, friends, colleagues will all exert different levels of influence and the individual will have different thresholds for adopting an innovation depending on what it is.

We’re nowt but sheep

Secondly, the more a person is exposed to an idea, the more likely they are to adopt it – think about all your friends who have purchased an iPhone based on the amount of nagging from iPhone users. This in turn, results in a self-perpetuating effect where the idea gets even more exposure and thus more adopters.  An example of this would be the web, where popular websites continue to attract more links than less popular ones.  Often refered to as preferential attachment, it is a case of the rich getting richer. In the PR industry a blogger starting his blog will probably include popular blogs such as Stuart‘s or Richard Edelman‘s blogs (both of which were created before I was born) on their blog rolls because they have heard about it from their peers. (It is also worth reading about information cascades for further evidence that we rarely make a decision on our own)

Social pressure also plays a part during the adoption process, especially if the innovation becomes popular or cool. This could be due to peer pressure and overlaps with the idea of social currency – where people do stuff to talk about it – such as buying the latest CDs or in my case, reading The Sun every morning the week before I go see my friends in Bradford. Using the example above, the new blogger may want to be seen to be reading Stuart’s blog because it’s what everyone else is reading and it also gives the blogger something to talk about/share when he meets like minded people at the various networking dos.

The pressure to adopt an idea might also be a practical one. According to Metcalfe’s law “the value of a telecommunications network is proportional to the square of the number of connected users of the system (n squared)”. Without paying too much attention to the maths (n squared should be seen as a generalisation rather than an exact formula to work out ‘usefulness and that’), you can see that during the 90’s, as more people adopted email systems in their communications it became increasingly difficult for others not to adopt. This effect can also lower individual thresholds for adoption, making it less risky for people to try new ideas or products. You could argue that Twitter has become less useful as ‘people’ like Megan start using the channel – I’ve certainly found it less useful for information since I started following more people. However, saying that, if more of my mates from Bradford starting using it, that would change and Twitter could become  useful for finding out who has just had another kid, who’s been in jail, who’s managed to use a computer for something other than porn, etc.

Super susceptible vs. Super influencers

By understanding how the diffusion process works, one of the things we can do is identify groups of people who are more suseptible to persuasion and target them instead of the traditional “super influencers”.

In a directed network, nodes with more inbound links are the ones more likely to be ‘infected’. The ‘exposure’ of a node may result in the person simply having more chance of hearing about the product or could lead to more intense social pressure to conform. (I’m ignoring for this post the idea that each person has different thresholds when adopting an innovation, and the type of innovations itself). In a real world setting, it you were looking for a prominent tech blogger, the bloggers who are more likely to have their head turned are those that also subscribe to a large number of relevant blogs. Note the use of the term ‘relevant’ – as in relevant to the network you are targeting. If the blogger reads a large number of blogs that are not relevant to technology, for example, then they are less likely to conform because they are likely to have more influences. In an extreme case scenario, Apple releases an update for its iPhone and lets the users of various Mac forums know how amazing it is. Members of all the forums will be bombarded with positive messages and those that subscribe to a large number of these forums and little else will have very little evidence to distrust Apple’s claims that the new iPhone makes you 30 per cent more interesting to other iPhone users (to everyone else you are 70 per cent duller and geekier – it’s a made up fact that since Mat got an iPhone, 80 per cent of our conversations is spent talking about apps).

This is also linked to the strength of weak ties concept I mentioned in my last post. The people who have more ‘weak’ ties – i.e. peripheral to a network – are likely to have more information at their disposal (one of the reasons the UK PR social media scene often feels like an annoying echo chamber) and therefore less likely to conform (although conversely – and I know I’m contradicting myself here slightly, they are more likely to be early adopters of new innovations). Again, using the example above, those that read a more diverse range of forums, blogs, etc are more likely to be informed of flaws and/or alternatives to the latest iPhone update. What I’m saying is that those with many weak ties are less likely to conform to norms and more likely to try new ideas, products.

Using tools such as Pajek, we could find whole groups of people who will be more likely to adopt the innovation. For example, you could work out how centralised (connected) a network is – a network with more connections means that messages will spread more effectively. If it is less connected and full of bottlenecks (often called cut vertices and bridges – nodes and lines which when removed disconnect a network completely) then the messages will take longer to spread if at all.

PR 2

Above is a quick sociograph of the PR comms industry. Using Netdraw (software which let’s you analyse networks), I’ve resized the nodes so that the more blogs they link to, the larger they are. Therefore we can see that Richard Bailey, Tom Murphy and We Are Social new boy, Simon Collister appear to be more susceptible to change.  There are also two areas of interest – the one to the right of the centre appears to be a group of educational-focused blogs.  Please bear in mind that this diagram was literally created in minutes,  I took Brendan Cooper’s PR Index and mixed it with Jed‘s blog roll. Hardly scientific, it’s probably far from accurate and what’s to say that Simon is actually still reading blogs? I just wanted to illustrate what I meant and just realised that this blog post was well text heavy.

*Minor update – I’m getting confused between new innovations and adopting ideas here. People on peripheral of network (strength of weak ties) are more likely to adopt new ideas/products, people who have a lot of influencers are more likely to conform. At least I think that’s what I mean…

What do you do once you have identified these areas of high susceptibility? I think it would help in a campaign where we needed purely numbers – i.e. we need X amount of coverage (which is still often the case in PR). We would seed the information in positions with a high centrality (Markov or otherwise – though the recommendation from the brainy people seems to be nodes with high betweeness centrality) so that the message would spread to many people.  By analysing the network and working out how susceptible it is to change, we can alter our tactics accordingly. For example, memes would spread much more effectively in a connected network such as the PR blogging network in comparison to a network of mid-level accountants – who, if you were trying to reach, you might use one to one meetings.

It would also help when setting goals for clients. Blogger outreach programmes are still an unknown quality – some work, others don’t – it’s due to the individuality of each blogger (and often your relationship with them) as to whether it is a success or not. The traditional media is much more predictable and established. Although you are essentially still selling your story to an individual when pitching to traditional media, ground rules have been set and they are much more consistent with what they are writing about. However, by identifying areas of high susceptibility, you could get a better idea of how a campaign will spread in a network.

Critical mass

Now I’ve hopefully established that what I’m writing does have some foundation in truth, let’s look at how it could be useful.

There’s one aspect of diffusion, which I’ve found particularly interesting and hopefully relates to our day-to-day PR trudge. During some instances of adoption, something called Critical Mass occurs, which is the point where there are a minimum number of adopters needed to sustain the process. It’s a tipping point (notice the lack of capitals – I’m not referring to Gladwell’s often criticised theories, I’m using it as a general term), when the innovation has enough momentum for it to reach the whole network and sustain – and fuel – its own growth.

It is similar to the way bacteria develops – either it does not develop quickly enough and anti-bodies wipe them out, or it grows quickly enough that it multiplies and overwhelms the body’s defence.

If networks are critical to adoption, there are a couple of rules of thumb. Bear with me here. When the idea has been adopted by between 10-20 per cent of the people who will eventually adopt – (it is no surprise to find that innovators and early adopters/opinion leaders represent 16 per cent of consumers and falls nicely in there) the acceleration of adoption rate decreases, although the adoption rate still increases. This is known as the first second order inflection point. Basically, people are still adopting the innovation but not as quickly. At this point, social cognition takes over the diffusion process and adoption reaches its critical mass – it has reached the point where enough people have adopted the idea that it self perpetuates (because of the some of the points highlighted earlier – social pressure, exposure and preferential attachment, etc), fueling its own growth. Random activity of unrelated events becomes seemingly more predictable as a kind of self-organisation takes over.

This is Roger’s innovation adoption curve shows what the diffusion process looks like:

*Stolen from http://www.mitsue.co.jp/english/case/concept/img/02/fig1.gif

The ‘S’ shaped curve being the cumulative rate of adoption (or diffusion curve) and the bell curve being the number of new adopters. So in an ideal rate of diffusion, the point of critical mass (which those Japanese fellas have labeled as the diffusion rate line on this graph) is around the point of the first inflexion in the ‘S’ shaped curve and is about 10-20 per cent the total number of adopters. Theoretically then, at the first inflexion we can assume that the total amount of eventual adopters will be between five and ten times the number at that point. As with triangles and the distance/speed/time diagram in physics,  if we knew the eventual number of people who will be adopting the idea (i.e. the client has set a goal of X number of people), we can predict what the critical mass should be and plan our comms activities accordingly. Am I making sense?

Facebook Ads and critical mass

Let me show you a real life example. I recently created a Facebook fan page for a client. We had no budget for Facebook ads and much of our traffic came from Twitter. I’ve tried to take into account the number of fans who joined the group as a result of an email from me or from Twitter (I used cli.gs to track as much as I could) but it’s far from perfect.

The graph looks like this:

Chart Facebook

And the numbers were as such:

Facebook fan

*Adoption rate is the number or percentage of new adopters at a particular moment in time; and the Acceleration is how quickly the innovation is being adopted.

At Time 3 the total number of fans is 29. Therefore, we could estimate that the number of eventual fans to be between 145 and 290 (the mean of which is 217.5). For this particular campaign, we had no targets set for the number of fans (and who’s to say that a fan page needs X amount of people to be successful?), but sometimes the client wants a certain number of fans for it to be deemed a success. So for example, if the client wants at least 1000 fans, at that point of critical mass we can see that there is very little chance we’d ever get close to reaching that number.

Creating momentum

The question (and solution?) is, could we then artificially create the required number of people through above and below the line activities to create the momentum needed to reach that goal? In the case of the Facebook Fan page we could create an ad campaign or target relevant groups promoting the fan page, inflating the numbers so that at the first point of inflexion, the number of fans is closer to 200 (and so the final number of fans is around 1000 at least).

Could we do the same during a blogger outreach programme? If the figures were not quite sufficient, we could spend more time targeting more bloggers in the network?

What we are essentially trying to create here is a ‘viral’ effect. I know viral, word of mouth, etc is an outcome not a strategy/tactic – but it’s not some mythical, impossible dream – there are some things we can do to try and achieve that effect. Mat has previously written a post about creating the appearance of acceleration on his blog, which talks about how evangelists do exactly what I’m proposing we do.

Caveats

Here’s a few things to consider and why I may have just waited an hour of your life. Critical mass theoretically exists only when the network is the key driver in adoption – i.e. the innovation spreads organically via social ties and word of mouth. To this end, it could be argued that if you artificially created the appearance of acceleration using above the line activities then you would not be relying solely on networks to promote your Facebook page – your fans would be isolated, unrelated groups of individuals who exist in different networks. However, the great thing about Facebook Fan pages (and why I’m a bigger advocate of them over Facebook groups for clients) is that you can use Facebook Ads to target audiences based on specific demographic and interests. Want to target a married male, aged 23 from London who has an interest in 3D animation? Facebook Ads lets you do that. While two people who have an interest in say, Manchester United may not be directly connected, they will exist within the same network. Studies have shown that people tend to associate with others who have a common interest. Known as Homophily, it is often expressed as the adage: Birds of a feather flock together. Therefore by targeting a specific demographic, you are in effect, targeting whole networks. Have a look at this post, to see many of the decisions we make are governed by our networks.

On the other hand, there is no actual proof that critical mass even exists. Even in examples where the point of critical mass is around 16 per cent of the overall population, it only implies that critical mass exists. There are also many that arguments as to which point in the adoption process critical mass actually takes place (some argue that it is when 50 per cent of all the population have adopted, while others believe that it is the period with the highest adoption rate).

Diffusion, also works on the assumption that innovators and early adopters influence the early majority. While I don’t doubt this, their influence may not be as profound as many believe. The idea that a chasm exists between this group and the early majority has been explored in Crossing the Chasm – a book I haven’t read so do not want to write about it too much. But basically, the network effect is not as simple as my fancy diagrams would have you believe.

Any way food for for thought and that and I hope you try some of this stuff out to prove me wrong. I’ve no idea why I spent so much time writing the second half of this post knowing that much cleverer people than me argue whether it is in fact bollocks.

Good night!

Creating an RSS feed for a Facebook group

*Update – I’m getting a few comments about the process outlined below not working. Apologies, but this was written back in August 2009 and Facebook appears to have changed the way you access groups. Feed43 seems to have a problem pulling the data from the page because you have to log in. I’ve since tried and there are ways around it but it’s not perfect so I do not want to update this post until I’ve figured it out properly.

While I’m still figuring out what I actually want to write about next, I thought I’d throw a freebie your way: Creating an RSS feed for a Facebook group.

One of the first things I do when tasked with finding what people are talking about online about a particular subject or client is to look on Facebook. With over 200 million members and 100 million people logging into their accounts at least once a day, there’s usually a lot of useful information ready for you to pillage / use for research purposes.

Facebook_group

Some of these groups you will want to monitor, especially groups that you have set up yourself. Facebook doesn’t allow you to create an RSS feed so you have to visit each group daily if you want to keep on top of the conversations. Or do you….?

Actually, you do have to visit each group if you don’t want to violate their terms and conditions:

“If you collect information from users, you will: obtain their consent, make it clear you (and not Facebook) are the one collecting their information, and post a privacy policy explaining what information you collect and how you will use it.”

However, if you are happy to tip toe around their terms and conditions (I emailed the creator of the group and asked him if I could set up an RSS feed so that my conscience is clear), here’s how you create an RSS feed to keep track of discussions within groups.

Using an RSS feed creator will help you make any plain old-school web page RSS enabled (not sure if that’s the right term). There are quite a few RSS feed creators out there but Feed43 seems to do the job well for me. Here’s how you use it:

Firstly paste the URL of the group page into the appropriate box. Wait while Feed43 uploads the page source of the web page. At this stage it can often be temperamental – saying that it page source hasn’t stacked. Keep trying though and it will work eventually.

feed1

<h3><span>The Wall{%}wall posts</a></div></div></div></div></div>
And in the third box type in the following:
<tr><td><a href=”{%}”><img{*}
class=”profile_link” >{%}</a>{*}
</div><div>{%}</div></td></tr></table>
What I’m saying here is:
“Hello Feed43, firstly have a look at the page source specifically everything between “<h3><span>The Wall” and “wall posts</a></div></div></div></div></div>”.</p>
Within that section, can you find the strings I’ve copied and pasted and extract all the bits that correspond with {%}? Thanks”
Try it with other sites. Fan pages don’t work for some reason though unless something’s changed in the last few months.

In the next box type:

<h3 class=”UIProfileBox_Header clearfix”><span class=”UIProfileBox_Title”>The Wall{%}wall posts</a></div></div></div></div></div>

And in the third box type in the following:

<tr><td class=”wallimage”><a href=”{%}”><img{*} a href=”http://www.facebook.com/people/{%}/{*} </div><div class=”walltext”>{%}</div></td></tr></table>

feed 2

What I’m saying here is:

“Hello Feed43, firstly have a look at the page source specifically everything between “<h3 class=”UIProfileBox_Header clearfix”><span class=”UIProfileBox_Title”>The Wall” and “wall posts</a></div></div></div></div></div>“.

Within that section, can you find the strings I’ve copied and pasted and extract all the bits that correspond with {%}? Thanks”

You then need  to tell feed43 how you want the information presented to you. feed43 will tell you that it has found five items (posts) and automatically generates the extracted (clipped) data, assigning a label {%n} to each section of information you want extracted.

In the next three boxes, you’ll have to assign each clipping to one of the following:

Item Title Template

Item Link Template

Item Content Template

So in this case, I’ve assigned the name of the author of the post to the Item Title Template {%2}, the link {%1) to the Item Link Template and the content Item Content Template {%3}.

feed3

Click the preview button and you should have something like this:

feed4
You can take the RSS feed and stick it in whichever RSS aggregator you use.

Facebook Fan pages don’t work for some reason though unless something’s changed in the last few months. Try it with other sites – it’s especially helpful for old school and relatively obscure B2B tech publications I’ve noticed.

Social network analysis and PR

For those who I haven’t bored to death talking about it, one of the things I’ve been reading up lately is social network analysis (SNA). I’m not claiming for one second to be an expert and probably opening the door for me to be shot down. But here goes…

Fingers crossed its going to solve all the problems of the PR industry, if not I’m wasted approximately 100 hours of my life. At the same time though, there’s nothing really all that special about it, like Social Object Theory, its just another way of thinking about communications.

From what I’ve read so far, social network analysis concerns itself more with the flow of information and the great thing is that it is all measurable (yep, numbers and that). No doubt, there will be some of you reading this post thinking “but its about the content, its about the conversation” – which is entirely true, but let’s stop being daft – we are not going to start sending people turds on the stick because we have a new toy to play with. This is just a way of targeting to make sure the message reaches the right people.

If you want an explanation looky here: http://en.wikipedia.org/wiki/Social_network – I’ve spent too many nights writing and re-writing the introduction of blog posts, trying to explain this stuff in a simple way, as such I now can’t be arsed. This post is going to dive straight in.

Defining influence
At Porter Novelli, we’ve been using our own network mapping tool to help identify ‘influential’ people in a network. ‘Influence’ is a bugger to define – is it popularity? reach? a combination of both? (if so how much emphasis would you place on popularity vs reach? 50/50? 70/30?) or is it something else entirely different? (See Jonny Bentwood and the gang at Edelman‘s crack at analysing the influence of Tweeters in their Twitter Index to look at just how complicated this stuff can be).

Within SNA, there are lots of ways you can measure the importance of a person/blog/website within a network. Below I’ve highlighted a few of them.

Look! A diagram!
To illustrate my points I will be using a basic sociograph called Krackhardt’s Kite – a popular reference point in SNA. It’s a simple undirected graph, which although there’s slightly more to it, basically means that if I read your blog, you automatically read mine. However, the principles are largely the same with directed graphs. I’ll try and explain things as I go on (I’m trying to write this so that you guys know what I’m talking about, but any proper SNA geeks stumbling to the blog don’t think I’m an idiot). If you need any of the terms explaining, this site is a good reference point: http://tinyurl.com/1rl8

Degree Centrality
This is roughly translated as popularity. Quite simply, it is the number of lines (sometimes called edges/arcs depending on whether they are undirected or directed and also known as paths, semi-paths, walks, etc, depending on what you are looking for – can you see why this blog post has taken me so long to write?!) the little round yellow things (the proper term is nodes, vertices or actors, again depending on what the network is illustrating) has. I think the correct definition of degree centrality is the number of ‘neighbours’ a node has. In the diagram above, node 7 has the highest degree centrality. It has six other nodes linking to it.

In the blogosphere (Hello Geeks!), this could be the number of inbound links a blog has. In the UK PR industry, I’m guessing node 7 would probably be your Neville Hobson‘s,David Brain‘s or Geordie chav, Stephen Davies‘ blogs.

You would target these when you want to break a story to as many people as possible very quickly. You might not reach everyone but it would create a massive, immediate impact. For example, if you had an exclusive story that was breaking, these guys would be the ones you would target.

It’s no surprise to find that the blogs I’ve literally plucked from the air have been going for some time. ‘Preferential attachment’ describes how popular websites become even more popular as time passes. If they are already an established, influential blog, then new bloggers will continue to link to them in the future. With reference to communications, PRs should be looking to develop these long-term relationships where possible in the same way they cultivate their journalist relations.

In ‘traditional’ PR, nodes with a high degree centrality would probably be the mainstream media.

Closeness centrality
This is a measurement of how close one node is to all the others in the network. For example, for node 7 to pass a message to node 9 it would have to pass through three lines. In the example network, nodes 4 and 5 have the highest closeness centrality. Mat suggested in a recent blog post:

Instead of looking for WOM influencers, why don’t we look for areas of high potential — and target those people who are likely to be
receiving lots of WOM stimuli?

Nodes with a high closeness centrality are more likely to be to be exposed to a message in a network. Conversely, if we targeted a blog with high closeness centrality, then the information would be spread throughout the network much easier.

But let’s look at it another way. This is not strictly closeness centrality (I’m just making it up as I go along…) but related. What if we singled out a specific node which spread the information to the whole network much more quickly? For example, if we seeded information with node 5 it would take 4 steps (including the initial seeding) for the message to spread to the entire network.

However, if we seeded content with node 8 we would see this:

Therefore we would target node 8. Apparently, I’ve just read that this is actually the Markov centrality, but I haven’t done enough research to really comment on it, so instead, happy to admit I’m making this stuff up.

With regards to PR and blogger outreach, I can see this targeting being more relevant when focusing on smaller, possibly niche groups – in the SNA world also known as cliques. Let’s say we wanted to target a group of IT directors based in lovely Bradford who blog (by my reckoning, there’s about seven of them – there’s only 100 computers in the whole of Bradford believe it or not) with a consistent flow of news. You have budget to build a relationship with them but Node 7, the most popular guy doesn’t have time to go for lunch (he works also works night shifts as a taxi driver and Sundays in the local chippie). Who would you target to build a relationship with? Possibly 8? If you need to make a major last minute announcement (e.g. the venue of an event has moved), targeting node 8 would get the message out the quickest.

Betweeness centrality
This is the one I’ve been using when describing SNA and how it works in comms. It basically sounds most impressive and ‘new’. According to Exploratory Social Network Analysis with Pajek (don’t ask…), Betweeness centrality rests on the notion that “a person is more central if he or she is more important as an intermediary in the communication network”. These nodes when taken out of the network restricts the flow of information (in the cases where they stop the information from flowing between two groups they are known as cut vertices).

Lets take for example two offices based in New York and London, the bosses of which both have PAs. Top level information flow between the two offices would more than likely involve the two PAs, neither are particularly popular (in the degree sense, not how nice they are). They would be the ones with high betweeness, take one of them out and the flow of information stops.

Another way of looking at it is by introducing a concept called ‘The Strength of Weak Ties‘. Without going into too much detail, it explains how your good mates might be good for a laugh down the pub or a visit to the strippers (it doesn’t use this example in the paper), but they are unlikely to tell you something you didn’t already know – their friends are your friends already. A weak tie, on the other hand, is someone you are acquainted with. Because they do not necessarily share the same friendship group, they are actually more useful because they can introduce you to new people or pass on new information.

The world needs these intermediaries to facilitate the spread of information and share ideas.

In the first diagram, the node with the highest betweeness centrality would be node 8. In a massive consumer campaign targeted at lots of different segments (and with limited budgets) these bloggers would be the ones who you can count on to spread the message between different sets of people.

Another way to look at it is during a crisis – a blogger has some how managed to get their hands on some highly confidential information and you don’t want it to break into the mass media. He’s decided to blog about it but only has about five readers who all only have a handful of readers each anyway even if they decided to blog about it. The exception is that one of the bloggers’ readers is known to be a well known journalist. It is this person that you should be most concerned about contacting to broker some sort of deal.

Much more to this stuff than I’ve written about

With my limited PR experience, I’ve tried to illustrate the strengths of each with examples with how you can look at influence in different ways. There are others such as Eigenvector centrality (which is not about how many people read blogger A’s blogs, but who reads it – Google uses this as a basis for its search engines), random walk centrality, bridging centrality, etc which I haven’t even touched upon yet. The truth is you would be thinking about all of them (and to be honest they overlap a lot anyway). Although I don’t know for certain (I’m looking into it now), I suspect you would place more emphasis depending on the type of network you are investigating. It’s possible to work out just how degree/closeness/betweeness centralised a network actually is and base your targeting around that.

But this is about efficiency. Although many PROs will claim to be experts at building relationships with bloggers, the truth of the matter is that there are just too many. You might have had an occasional pint with Wadds or Brucie, but how often will you be contacting them to pitch stuff (unless you just happen to be a plant seller and stumbled upon Wadds’s recent unhealthy infatuation with allotments). We work within an agency and probably work across loads of different sectors, I haven’t the time to really build relationships with many (and don’t lie, you don’t either), SNA could be a way of picking out the most effective ones.

Then it depends on the type of information you have. In an informal group, I’m likely to tell my friends about my workmate Roger‘s heroic quest to stop drinking for the whole year, despite my teasing. However, my friends would not tell their friends about Roger. Jesus this is getting complicated now. Competitions, news, reviews – they are all different types of content. Therefore, would you change the story (like you would/should with journos) depending on a blogger’s position in a network?

What about the campaign? Long term? Short term? Consumer? B2B? Does it change again?

There’s also an issue that I’m assuming the information will always flow from A to B via the shortest path (the correct term is its geodisic distance). Often this is not the case and while I might subscribe directly to Mashable, I might read the news on Jed or Jaz‘s blog first.

Are we thinking too much about this? I had a pub conversation with Marshall Manson just over a year ago when we were talking about metrics. Marshall said that you know it’s right in your gut. Though he’s got about a million years more experience in PR than I have so that’s easy for him to say.

It would be great to get old school PROs thoughts on the three criteria I’ve outlined above. I can seriously see SNA changing the face of PR, I just don’t quite have the experience of some of yous yet.

Right that’s taken me the whole of Saturday. See I told you, I’m still alive. See you in six month’s time.

Using Notepad++ in SEO

OK, I’m making this as I go along, you know that, I know that. [Well I’m not, I’m researching quite a bit, but you know what I mean] But it is 7.25pm right now and I finished work and I’m allowed to waste my time as much as I want – no one’s paying me. In fact the only one who’s paying, is me when my girlfriend reads this and realises that I don’t actually have to stay late at work. But then, like most people, she probably stopped reading immediately after reading the title.

So I’ve sorted my keywords into an Excel file by the web pages. Although many people disagree as to how many keywords you should have per page, I’m trying to keep the core keywords as low as I can and then add more generic qualifiers [i.e. agency, top 10, etc] once I’ve fed them through Google Adwords again to get a good balance between which are well searched for/have low competition.

Therefore, I’m seeing more generic phrases such as “PR agency”, “global PR company”, etc for the home page while more specific terms such as “digital agency” and “healthcare PR” will lead searchers to their respective pages.

The more specific keywords, the less traffic you will get. However, the more specific the keyword, the more relevant the traffic.

This is how I am collating keywords for the digital page. Basically I want every permutation from the digital list and the two lists from the generic qualifiers tab. I will end up with a list of words along the lines of: Top 10 digital PR; leading digital PR agency; etc.

Open up Notepad ++

Copy and paste the list of digital keywords list into Notepad++.
Copy the first term from the generic list. For this example, I’m only selecting “top” for now.
Return to the Notepad++ list of digital words.
Hit CTR+F to access the find and replace function.
As we are using regular expression make sure the option is highlighted.
Now in the find box search for “\n”. This will search for any new lines in the list.
Then replace this with “top” followed by a space.
Hit replace all and you should a list of words
something along the lines as below:

Digital
Top blog marketing
Top social media
Top social media advertising
Top social media blog
Top social media communication
Top social media communities
Top

Finally tidy it up manually and you should have a list like this.

Top Digital
Top blog marketing
Top social media
Top social media advertising
Top social media blog
Top social media communication
Top social media communities

Yes it’s time consuming but you’ll get there in the end.

My love for Notepad++

I’m writing this as I’m working. Partly to keep track of what I’m doing and partly for a break from what I’m doing.

OK bit of a divergence here.

This is a diary rather than a tutorial, but hell, I’m completely against writing about the social media scene (My colleagues, and folk I follow do a much better job of it than I ever will) so I’ll persist with this quick tutorial and hopefully the one(s) still reading will benefit from it.

I didn’t bother with Yahoo Pipes in the end. I decided that Yahoo Pipes would work but having drawn a whole load of graphs about how my Pipe might work, I gave up and decided Notepad++ would be sufficient.

Notepad is probably one of the least used programmes on your computer, barring Spider Solitaire and the Tour Windows XP programme. It’s ugly as sin, it doesn’t wrap the text so you can’t read what you are writing, there’s only one font and most importantly: there’s no spell checker. It’s basically only used by those who couldn’t afford Microsoft Works or Office [I seem to recall writing school essays using it] back in the day.

Notepad++ however, is the greatest upgrade in technology since someone stuck a II on the end of Streetfighter.

Remember the first time you looked at Netvibes or Bloglines? RSS? “What’s the point?”, you were thinking right? But then when you were persuaded to use them either on the recommendation of the sweet tongue of Mr McInnes, you couldn’t believe how you functioned without it.

Notepad++ is like that. Only better because you pretend you are Dougie Howser when you are using it.

This next bit will sound complicated, but believe me, I’m probably the most ill equipped person to deal with “computers and that” never mind programming. Seriously Bryony, try it – you’ll love it.

Grouping Keywords

So we’ve got a massive list of keywords that we should be using. Just out of interest I decided to see how many phrases [theoretically at least] we could have for our site.

Using the power of maths, a few useful sites and a bit of Notepad++ wizardy [Stuart Bruce and Mat Morrison regularly harp on about the beauty of using Excel effectively. For me Notepad++ is the same – have a look here for a good guide], I’ve worked out that we have over 13 million permutations just from the core and qualifier terms.

Obviously, not all of these will be useful. Using the classic PR trick of comparing data to make it more interesting, I’ve concluded that  if each keyword variable weighed one tonne, the weight of all the keywords combined would equal that of 130,000 Boeing 757-200 or 13 million hippos.

Again, I couldn’t find any real way of grouping keywords that made any sense to me. I kind of guessed that it would be logical if we group the keywords according the web pages we would want people to land on. So using our navigation page, I’ve set it out here .

Notepad++ was great for having an idea of the different permutations. I know Yahoo pipes can pull in data from Google docs. Let’s see if it can help me create a spreadsheet for search phrases. 

Finding your keywords (the long way)

Right, this is getting boring and taking ages.  But I have to keep going because some people are still asking about SEO. [By ‘people’ I mean those that it’s relevant to, not my best mate’s mum who tried to access the Web by inserting the Freeserve Internet CD in the VCR]. For me; I’m desperate to find out whether PR can actually do SEO.

I was meaning to write this a while back having done the actual work early-Jan but there were other priorities. Much of it is quite dull with just lists of keywords. So forgive me if I’m vague on some of the details as I try and write this post without chewing my own testicles to keep me awake.

As I’ve started researching the SEO space a little bit more, I’ve found that the amount of info out there is scary. You know how sometimes you can lose hours on a weekend just browsing through blogs even if they are regurgitating what everyone else has said? And then you kick yourself because it was time you could have spent playing XBOX, pacing around the flat or just stare time?

SEO is worse. Worse because in PR at least we speak in more everyday terms [partly because some PRs are better at applying theory to the real world, partly because some PRs don’t really understand what they’re talking about]. Worse because there are a gazillion blog and forums all decentralised with no real place to start.

Most people think that SEO is one of those exact sciences. How can you argue with code and search engine rankings? It’s black and white. Like a good haircut and bad haircut – there’s no argument. But as far as I can tell no one really knows how Google works [apart from Google obviously] and so a lot of it is educated guesswork. There’s as much debate here as there is in the social media space.

Although the level of importance of keywords is still in debate, there’s little doubt that they play a significant role in achieving high rankings on search engine results pages.  

There are some great free tools on the Web which can help with your keyword research – the most obvious being Google’s fantastic Keyword tool. By sticking in a search term you can see an approximation of the number of searches for that particular term/phrase and how much competition there is with using it. With Google being as great as they are, [try Google docs – there’s no going back] they also throw in some other phrases for you to suggest.

Using a combination of SEO tools via Raven [a lot of the tools it uses are free but it integrates them all brilliantly], I started building a list of keywords based on our brands, services and the industries we operate in. See here for the list of keywords.

From what I can gather there’s no real preferred method of grouping terms, so I thought what the hell? Why don’t I just make it up? [I genuinely had a look at how other people did this but none of them really satisfied me or gave a decent enough explanation as to why they were grouped that particular way].

The headings speak for themselves, the type of keywords however, I’ve tried to group logically, keeping in mind that these will eventually become key phrases as well as words.

Unique Terms:

Keywords that were specific to Porter Novelli. These included brands, content [i.e. whitepapers], spokespeople and names of our partner agencies. We should be pretty much at the top of all search engine results pages for these search queries excepting the more generic keywords.

Core Terms:

These keywords are sector/industry specific. This is where we want a high level of visibility. These are potential clients/employees who have decided what they want, but not who [Porter Novelli] they want to help them with it.

Qualifier Terms:

The core terms are too generic. Very few people looking for a help with their PR would merely “PR” they would search “Top PR agency” or “leading PR company”. I’ve included the location of all our offices too.

Negative terms:

I only found about negative keywords through looking on the Web. Apparently, Google knows if people who have clicked on your site immediately come back to Google because they do not find what they are looking for. Therefore, having an idea of negative keywords is important. I’ve basically stolen this excellent list of negative keywords to help with this project.

PR agency keywords

As I mentioned, I’m working on two different projects. This post is about the proper keyword research we hope to actually use for Porter Novelli as opposed to me messing around with diagrams and stuff.

This is really, really baby step stuff so bear with me here.

Doing a proper keyword search is much more complex and dullsome than my fun graph would suggest. It involves having a look at every single variation of your keywords and search terms and every different permutation – like watching paint dry several times but in different shades of beige.

I initially started with a list of core keywords which are unique-ish to Porter Novelli. These include “Porter Novelli” [obviously], spokespeople, office names, and various brands throughout our organisation. The way I saw it was that if people were actively looking for Porter Novelli brands or offices they should be able to find it easily.

Next, consider searchers who may not be actively looking for you, but looking for services you provide. For instance, we’d like anyone looking for a “health care PR agency” to visit us.

This is where it gets really dull, but will prove utterly invaluable. Basically, I’ve gone through our website looking through our services. I’ve listed them and used Google’s Keyword Tool to suggest variations [I’ve ignored misspelt words for now].

Therefore, for the term “public relations” I’ve got:
public relations
publicist
publicity
PR

[You’d do this for marketing / communications / etc too]

You then need terms that will complete the search. Again using Google’s Keyword Tool I found key terms which I grouped into:
Qualifier PR agency
Geography [“PR agency Texas”]
Industry [“health care PR agency Texas”]
Services [“Digital communications agency in Texas?”]
I couldn’t think of a decent term for the last one but often people search with another qualifier [“Top 10 PR agency Texas”].

This takes ages and involves redoing the Google Keyword tool for each term that comes up just in case you miss anything out.

Right, now that I’ve got that out of the way. Interesting stuff next time [hopefully]. I can’t even be bothered sticking a nice picture on this post.